✗ Close categories
 Ice Bucket Challenge
Animals
Apple
Apps & Smartphones
Artificial Intelligence
Arts
AT&T Inc.
Bank of America
Berkshire Hathaway
Business
Cardinal Health Inc
Cars
Celebrity
Chevron Corporation
Child Care
Christian News
Christian Videos
Chrysler Group
Citigroup
ConocoPhillips Company
Conspiracy Channels
Conspiracy theories
Conspiracy Videos
Consumer
Cooking & Recipes
Coronavirus
Costco Wholesale Corporation
Craigslist Inc.
Cryptocurrency
Culture & Media
CVS Caremark Corporation
Dance music & news
DIY
Ebola
Electronics
Entertainment
Exploding Kittens
Express- Scripts- Holding- Company
Exxon Mobil Corporation
Facebook Inc.
Fashion
Federal National Mortgage Assocation
Films/Movies & reviews
Finance
Flat Earth News
Food
Ford Motor Company
Funny videos
Gadgets
games
General Electric Company
General Motors
General News
Google Inc.
Gossip news
Gourmet
Gulden
Health
Hewlett-Packard Company
Home
ID&T
International Business Machines Corporation
International Crime
JPMorgan Chase & Co
Kepler-186f planet
Leisure time
Leisure trends
Life & Style
Literature
Maranon Hammocks
Marathon Petroleum Corporation
McDonald's
McKesson Corporation
Medical
Microsoft Corporation
Movies
Music
News videos
Obituaries
Olympic Games
Organic food
Politics
Quantum Computing
Reddit
Royal Dutch Shell
Sci-Tech
Social media
social media news
Technology
Television
The Kroger Company
The Walking Dead
Top 25 Zoos
Top10 twitter accounts
Traffic
Travel
Twitter Inc
UFO News and more
US Elections
Vacancies
Valero Energy Corporation
Verizon Communications Inc.
Virtual & Augmented Reality
Walmart
Weather
Web design
White House
Woman - Best beauty products & news
Woman - Feminism & world's most powerful women
Woman - Food & recipes
Woman - Hair ideas & tips
Woman - Interior & assecoires
Woman - Latest fashion trends
Woman - Make-up ideas & tips
Woman - Pregnancy & childbirth
Woman - Relationship tips & advice
Woman - Skin care tips
Woman - Weight loss & healty recipes
Women - Breast cancer
Women - Most luxurious jewelry brands & news
Women - Beauty salon & spa
Women - Sexy & luxury lingerie
World News
Youth & Parenting
✗ Close categories
✗ Close categories
✗ Close categories
Alexandr Dolgopolov
American Football
Andy Murray
Athletics
Badmington
Baseball
Baseball - Arizona Diamondbacks
Baseball - Atlanta Braves
Baseball - Baltimore Orioles
Baseball - Boston Red Sox
Baseball - Chicago Cubs
Baseball - Chicago White Sox
Baseball - Cincinnati Reds
Baseball - Cleveland Indians
Baseball - Colorado Rockies
Baseball - Detroit Tigers
Baseball - Houston Astros
Baseball - Kansas City Royals
Baseball - Los Angeles Angels of Anaheim
Baseball - Los Angeles Dodgers
Baseball - Miami Marlins
Baseball - Milwaukee Brewers
Baseball - Minnesota Twins
Baseball - New York Mets
Baseball - New York Yankees
Baseball - Oakland Athletics
Baseball - Philadelphia Phillies
Baseball - Pittsburgh Pirates
Baseball - San Diego Padres
Baseball - San Francisco Giants
Baseball - Seattle Mariners
Baseball - St. Louis Cardinals
Baseball - Tampa Bay Rays
Baseball - Texas Rangers
Baseball - Toronto Blue Jays
Baseball - Washington Nationals
Basketball
Basketball - Atlanta Hawks
Basketball - Boston Celtics
Basketball - Brooklyn Nets
Basketball - Charlotte Hornets
Basketball - Chicago Bulls
Basketball - Cleveland Cavaliers
Basketball - Dallas Mavericks
Basketball - Denver Nuggets
Basketball - Detroit Pistons
Basketball - Golden State Warriors
Basketball - Houston Rockets
Basketball - Indiana Pacers
Basketball - Los Angeles Clippers
Basketball - Los Angeles Lakers
Basketball - Memphis Grizzlies
Basketball - Miami Heat
Basketball - Milwaukee Bucks
Basketball - Minnesota Timberwolves
Basketball - New Orleans Pelicans
Basketball - New York Knicks
Basketball - Oklahoma City Thunder
Basketball - Orlando Magic
Basketball - Philadelphia 76ers
Basketball - Phoenix Suns
Basketball - Portland Trail Blazers
Basketball - Sacramento Kings
Basketball - San Antonio Spurs
Basketball - Toronto Raptors
Basketball - Utah Jazz
Basketball - Washington Wizards
Body building
Boxing
Cheerleading
Cricket
Cycling
Dancing
David Ferrer
David Goffin
Downhill Skiing
Ernests Gulbis
Fabio Fognini
Feliciano Lopez
Figure Skating
Football - Arizona Cardinals
Football - Atlanta Falcons
Football - Baltimore Ravens
Football - Buffalo Bills
Football - Carolina Panthers
Football - Chicago Bears
Football - Cincinnati Bengals
Football - Cleveland Browns
Football - Dallas Cowboys
Football - Denver Broncos
Football - Detroit Lions
Football - Green Bay Packers
Football - Houston Texans
Football - Indianapolis Colts
Football - Jacksonville Jaguars
Football - Kansas City Chiefs
Football - Miami Dolphins
Football - Minnesota Vikings
Football - New England Patriots
Football - New Orleans Saints
Football - New York Giants
Football - New York Jets
Football - Oakland Raiders
Football - Philadelphia Eagles
Football - Pittsburgh Steelers
Football - San Diego Chargers
Football - San Francisco 49ers
Football - Seattle Seahawks
Football - St. Louis Rams
Football - Tampa Bay Buccaneers
Football - Tennessee Titans
Football - Washington Redskins
Formula 1
Formula 1 - Force India Videos
Formula 1 - Infiniti Red Bull Racing Videos
Formula 1 - Live Stream & News
Formula 1 - McLaren Videos
Formula 1 - Mercedes AMG Petronas Videos
Formula 1 - Sauber F1 Team Videos
Formula 1 - Scuderia Ferrari Videos
Formula 1 - Scuderia Toro Rosso Videos
Formula 1 - Team Lotus Videos
Formula 1 - Williams Martini videos
Gael Monfils
Gilles Simon
Golf
Grigor Dimitrov
Gymnastics
Horse Racing
Ice Hockey
Ice Hockey - Anaheim Ducks
Ice Hockey - Arizona Coyotes
Ice Hockey - Boston Bruins
Ice Hockey - Buffalo Sabres
Ice Hockey - Calgary Flames
Ice Hockey - Carolina Hurricanes
Ice Hockey - Chicago Blackhawks
Ice Hockey - Colorado Avalanche
Ice Hockey - Columbus Blue Jackets
Ice Hockey - Dallas Stars
Ice Hockey - Detroit Red Wings
Ice Hockey - Edmonton Oilers
Ice Hockey - Florida Panthers
Ice Hockey - Los Angeles Kings
Ice Hockey - Minnesota Wild
Ice Hockey - Montreal Canadiens
Ice Hockey - Nashville Predators
Ice Hockey - New Jersey Devils
Ice Hockey - New York Islanders
Ice Hockey - New York Rangers
Ice Hockey - Ottawa Senators
Ice Hockey - Philadelphia Flyers
Ice Hockey - Pittsburg Penguins
Ice Hockey - San Jose Sharks
Ice Hockey - St. Louis Blues
Ice Hockey - Tampa Bay Lightning
Ice Hockey - Toronto Maple Leafs
Ice Hockey - Vancouver Canucks
Ice Hockey - Washington Capitals
Ice Hockey - Winnipeg Jets
Ivo Karlovic
Jeremy Chardy
Jo-Wilfried Tsonga
John Isner
Julien Benneteau
Kei Nishikori
Kevin Anderson
Lacrosse
Leonardo Mayer
Marin Cilic
Milos Raonic
MMA
Nascar
NBA twitter top10
NFL
Novak Djokovic
Pablo Cuevas
Philipp Kohlschreiber
Rafael Nadal
Richard Gasquet
Roberto Bautista Agut
Roger Federer
Skateboarding
Skiing
Soccer - Atlanta United FC
Soccer - Chicago Fire
Soccer - Colorado Rapids
Soccer - Columbus Crew
Soccer - D.C. United
Soccer - FC Dallas
Soccer - Houston Dynamo
Soccer - LA Galaxy
Soccer - Los Angeles Football Club
Soccer - Major League
Soccer - Montreal Impact
Soccer - New England Revolution
Soccer - New York City FC
Soccer - New York Red Bulls
Soccer - Orlando City SC
Soccer - Philadelphia Union
Soccer - Portland Timbers
Soccer - Real Salt Lake
Soccer - San Jose Earthquakes
Soccer - Seattle Sounders FC
Soccer - Sporting Kansas City
Soccer - Toronto FC
Soccer - United States Soccer Federation
Soccer - Vancouver Whitecaps FC
Stanislas Wawrinka
Swimming
Tennis
Tomas Berdych
Tommy Robredo
Top 30 tennis players
Volleyball
World Cup soccer
World Soccer
Wrestling
✗ Close categories
✗ Close categories
✗ Close categories
Akron
Alabama
Alaska
Albuquerque
Anaheim
Anchorage
Arizona
Arkansas
Arlington
Atlanta
Aurora
Austin
Bakersfield
Baltimore
Baton Rouge
Birmingham
Boston
Buffalo
California
Chandler
Charlotte
Chesapeake
Chicago
Chula Vista
Cincinnati
Cleveland
Colorado
Colorado Springs
Columbus
Connecticut
Corpus Christi
Dallas
Delaware
Denver
Detroit
Durham
El Paso
Florida
Fort Wayne
Fort Worth
Fremont
Fresno
Garland
Georgia
Glendale
Greensboro
Hawaii
Henderson
Hialeah
Hollywood
Honolulu
Houston
Idaho
Illinois
Indiana
Indianapolis
Iowa
Jacksonville
Jersey City
Kansas
Kansas City
Kentucky
Laredo
Las Vegas
Lexington
Lincoln
Long Beach
Los Angeles
Louisiana
Louisville
Lubbock
Madison
Maine
Maryland
Massachusetts
Memphis
Mesa
Miami
Michigan
Milwaukee
Minneapolis
Minnesota
Mississippi
Missouri
Modesto
Montana
Montgomery
Nashville
Nebraska
Nevada
New Hampshire
New Jersey
New Mexico
New Orleans
New York
Newark
Norfolk
North Carolina
North Dakota
NY Bronx
NY Brooklyn
NY Chinatown
NY Manhattan
NY Queens
NY Staten Island
Oakland
Ohio
Oklahoma
Oklahoma City
Omaha
Oregon
Orlando
Pennsylvania
Philadelphia
Phoenix
Pittsburgh
Plano
Portland
Raleigh
Reno
Rhode Island
Riverside
Rochester
Sacramento
Saint Louis
Saint Paul
Saint Petersburg
San Antonio
San Diego
San Francisco
San Jose
Santa Ana
Scottsdale
Seattle
Shreveport
South Carolina
South Dakota
Stockton
Tampa
Tennessee
Texas
Toledo
Tulsa
Tuscon
Utah
Vermont
Virginia
Virginia Beach
Washington
West Virginia
Wichita
Wisconsin
Wyoming
✗ Close categories
✗ Close categories
✗ Close categories
Alternative rock
Blues
Classic Rock & Pop
Country news
Country videos
Dance news
Dance videos
Dubstep news & videos
EDM
Heavy Metal
Hip-Hop news
Hip-Hop videos
Jazz
Latin
Minimal Techno
New EDM, Trance, Hip hop and R&B Music
Pop videos
R&B Hip-Hop news
R&B Hip-Hop videos
R&B News
R&B videos
Reggae
Retro Trance & Dance Music
Rock
Soul
Soundrange Dub Rebel
Spinnin' Records
Techno News & mixes
Trance Music
Trance news
Urban & Caribbean
✗ Close categories
✗ Close categories
✗ Close categories
Aaron Rodgers
Adam Sandler
Adele
Al Pacino
Amanda Seyfried
Amy Adams
Angelina Jolie
Ashley Judd
Ashton Kutcher
Barack Obama
Ben Affleck
Beyoncé
Big Sean
Bill Gates
Bill Murray
Billie Eilish
Bon Jovi
Brad Pitt
Bradley Cooper
Brendan Jordan
Britney Spears
Bruce Springsteen
Bruce Willis
Bruno Mars
Bryan Cranston
Busta Rhymes
Cameron Diaz
Catherine Zeta-Jones
Channing Tatum
Charlie Sheen
Chris Hemsworth
Christina Aguilera
Christoph Waltz
Danny Trejo
David Beckham
David Hasselhoff
David Letterman
Denzel Washington
Derek Jeter
DJ 3lau
DJ Above & Beyond
DJ Afrojack
DJ Alesso
DJ Aly & Fila
DJ Andrew Rayel
DJ Angerfist
DJ Armin Van Buuren
DJ Arty
DJ ATB
DJ Audien
DJ Avicii
DJ Axwell
DJ Bingo Players
DJ Bl3ND
DJ Blasterjaxx
DJ Borgeous
DJ Borgore
DJ Boy George
DJ Brennan Heart
DJ Calvin Harris
DJ Carl Cox
DJ Carnage
DJ Code Black
DJ Coone
DJ Cosmic Gate
DJ Da Tweekaz
DJ Dada Life
DJ Daft Punk
DJ Dannic
DJ Dash Berlin
DJ David Guetta
DJ Deadmau5
DJ Deorro
DJ Diego Miranda
DJ Dillon Francis
DJ Dimitri Vegas & Like Mike
DJ Diplo
DJ Don Diablo
DJ DVBBS
DJ Dyro
DJ Eric Prydz
Dj Fabian (DJ Fabvd M)
DJ Fedde Le Grand
DJ Felguk
DJ Ferry Corsten
DJ Firebeatz
DJ Frontliner
DJ Gabry Ponte
DJ Gareth Emery
DJ Hardwell
DJ Headhunterz
DJ Heatbeat
DJ Infected Mushroom
DJ John O'Callaghan
DJ Kaskade
DJ Knife Party
DJ Krewella
DJ Kura
DJ Laidback Luke
DJ Madeon
DJ MAKJ
DJ Markus Schulz
DJ Martin Garrix
DJ Merk & Kremont
DJ Mike Candys
DJ Nervo
DJ Nicky Romero
DJ Noisecontrollers
DJ Oliver Heldens
DJ Orjan Nilsen
DJ Paul Van Dyk
DJ Porter Robinson
DJ Quentin Mosimann
DJ Quintino
DJ R3hab
DJ Radical Redemption
DJ Richie Hawtin
DJ Sander Van Doorn
DJ Sebastian Ingrosso
DJ Showtek
DJ Skrillex
DJ Snake
DJ Steve Angello
DJ Steve Aoki
DJ Tenishia
DJ The Chainsmokers
DJ Tiddey
DJ Tiesto
DJ TJR
DJ Umek
DJ Ummet Ozcan
DJ Vicetone
DJ VINAI
DJ W&W
DJ Wildstylez
DJ Wolfpack
DJ Yves V
DJ Zatox
DJ Zedd
DJ Zomboy
DMX
Donald Trump
Dr. Dre
Dr. Phil McGraw
Drew Brees
Dwayne Johnson
Dwyane Wade
Eddie Murphy
Edward Snowden
Ellen DeGeneres
Emily Mortimer
Eminem
Emma Thompson
Famke Janssen
Farrah Fawcett
Floyd Mayweather
Floyd Mayweather- Boxing
Franco Nero
Gabby Douglas
Gabriel Macht
Garth Brooks
Gemma Arterton
George Clooney
George Pal
Gisele Bundchen
Glenn Beck
Golshifteh Farahani
Greg Giraldo
Gwyneth Paltrow
Howard Stern
Hulk Hogan
Ice Cube
J.J. Abrams
Jack Nicholson
James Caviezel
James Patterson
Jane Fonda
Jason Aldean
Jason Bateman
Jason London
Jason Schwartzman
Jason Statham
Jay Leno
Jay-Z
Jeananne Goossen
Jennifer Aniston
Jennifer Garner
Jennifer Lawrence
Jennifer Lopez
Jeremy Renner
Jerry Seinfeld
Jessica Alba
Jessica Chastain
Jim Carrey
Jim Parsons
Jimmy Buffett
Jimmy Fallon
Joel Zimmerman
John Green
John Malkovich
Johnny Depp
Jon Hamm
Jon Lester
Jon Stewart
Joss Whedon
Jude Law
Judy Sheindlin
Julia Roberts
Justin Bieber
Justin Timberlake
Kaley Cuoco
Kanye West
Kate Upton
Kathleen Turner
Katy Perry
Kelly Lynch
Kenny Chesney
Kerry Washington
Kevin Durant
Kevin Hart
Kevin Spacey
Kim Kardashian
Kobe Bryant
Kristen Stewart
Lady Gaga
LeBron James
Leonardo DiCaprio
Lil Wayne
Lindsay Lohan
Lucas Black
Luke Bryan
Madonna
Mahendra Singh Dhoni
Maksim Vitorgan
Manny Pacquiao
Maria Sharapova
Marisa Tomei
Mark Harmon
Mark Wahlberg
Mark Zuckerberg
Martin Sheen
Mary-Louise Parker
Matt Damon
Matthew McConaughey
Megan Fox
Meryl Streep
Method Man
Michael Bay
Michael Jordan
Michael Phelps
Mickey Rourke
Mike Tyson & Boxing
Miley Cyrus
Morgan Freeman
Mos Def
Naomi Watts
Natalie Portman
Natalya Rudakova
Neil Patrick Harris
Nicolas Cage
Nicole Kidman
Novak Djokovic
One Direction- Band
Oprah Winfrey
P!nk
Paige Simpson
Pamela Anderson
Patricia Arquette
Patrick Wilson
Paul Rudd
Peter Billingsley
Peyton Manning
Pharrell Williams
Phil Mickelson
Philip Seymour Hoffman
Rafael Nadal
Rihanna
Robert De Niro
Robert Downey Jr
Robert Pattinson
Robert Redford
Roger Federer
Roman Coppola
Ron Howard
Ron Jeremy
Rush Limbaugh
Ryan Seacrest
Sandra Bullock
Sarah Jessica Parker
Sarah Shahi
Scarlett Johansson
Sean "Diddy" Combs
Sean Hannity
Sean Penn
Selena Gomez
Serena Williams
Seth MacFarlane
Seth Rogen
Shakira
Shia LaBeouf
Skylar Astin
Snoop Dogg
Sofia Vergara
Stacey Dash
Stephen King
Steven Spielberg
Sylvester Stallone
Taylor Swift
The Eagles- Band
Tiger Woods
Tim Tebow
Toby Keith
Tom Cruise
Tom Hanks
Tom Hardy
Tommy Lee Jones
Tyler Perry
Usain Bolt
Veronica Roth
Vin Diesel
Vince Vaughn
Vincent D'Onofrio
Viola Davis
Warren Buffet
Wesley Snipes
Will Ferrell
Will Smith
William Shatner
Zooey Deschanel
✗ Close categories
✗ Close categories
✗ Close categories
Accountancy
Administration
Advertising
Aerospace
Agriculture
Analyst
Animals
Antique
Archaeology
Architecture
Arts
Astrology
Astronomy
Automotive
Aviation
Bakery
Biotechnology
Cabaret
Call center
Car News
Care
Catering
Charities
Chemistry
Child care
Cinema, Theater & TV
Cleaning industry
Coaching
Construction
Customs
Dairy industry
Dance & ballet
Debt collection agencies
Defense
Dj
Economy
Education & Training
Entrepreneur
Financial
Firefighter
Fisheries
Flowers
FMCG
Food
Fruit & Vegetables
Gardener
Genealogy
General News
Government
Hair stylist
Hotel
HR & Recruitment
ICT
Insurance
IT Executive
Jobs
Justice
Lawyer
Legal
Library
Logistics
Marketing
Meat industry
Medical Industry
Mining
Nurse
Online Trends
Painter
Pharmaceutical
Pharmacy
Photography
Physical therapy
Police
Political
PR Public relations
Production & Industry
Project Management
Psychology
Public Transport
Publisher
Real estate
Rehab
Research & Development
Restaurant
Retail
Sales
Security
SEO
Shipping
Social work
Sustainable Energy
Teacher
Telecom
Tourism
Traditional Energy
Transport
Travel Industry
Vacancies
Vegetables
Web Design
✗ Close categories
✗ Close categories
✗ Close categories
$ABBC ABBC Coin
$ABT Arcblock
$ADA Cardano
$ADK Aidos Kuneen
$AE Aeternity
$AGVC AgaveCoin
$AION Aion
$ALGO Algorand
$ANT Aragon
$ARDR Ardor
$ARK Ark
$ATOM Cosmos
$BASE Base Protocol
$BAT Basic Attention Token
$BCD Bitcoin Diamond
$BCH Bitcoin Cash
$BCN Bytecoin
$BCZERO Buggyra Coin Zero
$BDX Beldex
$BEAM Beam
$BF BitForex Token
$BHD BitcoinHD
$BHP BHPCoin
$BIX Bibox Token
$BLOCK Blocknet
$BNB Binance Coin
$BNK Bankera
$BNT Bancor
$BOA BOSAGORA
$BONDLY Bondly
$BOTX botXcoin
$BRD Bread
$BRZE Breezecoin
$BST BlockStamp
$BSV Bitcoin SV
$BTC Bitcoin
$BTC2 Bitcoin 2
$BTG Bitcoin Gold
$BTM Bytom
$BTMX BitMax Token
$BTS BitShares
$BTT BitTorrent
$BUSD Binance USD
$BXK Bitbook Gambling
$CCA Counos Coin
$CENNZ Centrality
$CHSB SwissBorg
$CHZ Chiliz
$CIX100 Cryptoindex.com 100
$CKB Nervos Network
$CNX Cryptonex
$CRO Crypto.com Coin
$CRPT Crypterium
$CSC CasinoCoin
$CTXC Cortex
$CVC Civic
$DAG Constellation
$DAI Multi-collateral DAI
$DASH Dash
$DCN Dentacoin
$DCR Decred
$DDIM DuckDAO Dime
$DENT Dent
$DGB DigiByte
$DGD DigixDAO
$DGTX Digitex Futures
$DIVI Divi
$DMT DMarket
$DOGE Dogecoin
$DPT Diamond Platform Token
$DRG Dragon Coins
$DTR Dynamic Trading Rights
$DUCK Duck Liquidity Pool
$DX DxChain Token
$ECOREAL Ecoreal Estate
$EDC EDC Blockchain
$EKT EDUCare
$ELA Elastos
$ELF aelf
$ENG Enigma
$ENJ Enjin Coin
$EON Dimension Chain
$EOS EOS
$ERD Elrond
$ETC Ethereum Classic
$ETH Ethereum
$ETN Electroneum
$ETP Metaverse ETP
$EURS STASIS EURO
$EVR Everus
$FAB FABRK
$FCT Factom
$FET Fetch.ai
$FLG Folgory Coin
$FST 1irstcoin
$FTM Fantom
$FTT FTX Token
$FUN FunFair
$FXC Flexacoin
$GAP GAPS
$GNO Gnosis
$GNT Golem
$GO GoChain
$GRIN Grin
$GRS Groestlcoin
$GT Gatechain Token
$GTN GlitzKoin
$GXC GXChain
$HBAR Hedera Hashgraph
$HC HyperCash
$HEDG HedgeTrade
$HOT Holo
$HPT Huobi Pool Token
$HT Huobi Token
$HYN Hyperion
$ICX ICON
$IGNIS Ignis
$ILC ILCoin
$INB Insight Chain
$INO INO COIN
$IOST IOST
$IOTX IoTeX
$JUL Joule
$JUP Jupiter
$KAN BitKan
$KBC Karatgold Coin
$KCS KuCoin Shares
$KICK KickToken
$KMD Komodo
$KNC Kyber Network
$LA LATOKEN
$LAMB Lambda
$LBA Cred
$LEND Aave
$LEO UNUS SED LEO
$LINA Linear Finance
$LINK Chainlink
$LOKI Loki
$LOOM Loom Network
$LRC Loopring
$LSK Lisk
$LTC Litecoin
$LUNA Terra
$MAID MaidSafeCoin
$MANA Decentraland
$MATIC Matic Network
$MB MineBee
$MCO MCO
$MDA Moeda Loyalty Points
$MIN MINDOL
$MIOTA IOTA
$MKR Maker
$MOF Molecular Future
$MONA MonaCoin
$MTL Metal
$MX MX Token
$NANO Nano
$NAS Nebulas
$NEO Neo
$NET NEXT
$NEW Newton
$NEX Nash Exchange
$NEXO Nexo
$NMR Numeraire
$NOAH Noah Coin
$NPXS Pundi X
$NRG Energi
$NULS NULS
$NXT Nxt
$OCEAN Ocean Protocol
$OKB OKB
$OMG OmiseGO
$ONE BigONE Token
$ONE Harmony
$ONT Ontology
$PAI Project Pai
$PAX Paxos Standard
$PIVX PIVX
$PLC PLATINCOIN
$POOLZ Poolz
$POWR Power Ledger
$PPAY PlasmaPay
$PPT Populous
$PZM PRIZM
$QASH QASH
$QBIT Qubitica
$QC QCash
$QNT Quant
$QTUM Qtum
$R Revain
$RCN Ripio Credit Network
$RDD ReddCoin
$REN Ren
$REP Augur
$RIF RIF Token
$RLC iExec RLC
$ROX Robotina
$RUNE THORChain
$RVN Ravencoin
$SAI Single Collateral DAI
$SC Siacoin
$SEELE Seele
$SNT Status
$SNX Synthetix Network Token
$SOLVE SOLVE
$STEEM Steem
$STORJ Storj
$STRAT Stratis
$STREAM Streamit Coin
$STX Blockstack
$SXP Swipe
$SYS Syscoin
$TAGZ5 TAGZ5
$THETA THETA
$THR ThoreCoin
$THX ThoreNext
$TNT Tierion
$TOMO TomoChain
$TRAT Tratin
$TRUE TrueChain
$TRX TRON
$TT Thunder Token
$TUSD TrueUSD
$UBT Unibright
$USDC USD Coin
$USDK USDK
$USDT Tether
$VEST VestChain
$VET VeChain
$VITAE Vitae
$VLX Velas
$VSYS V Systems
$VTC Vertcoin
$WAN Wanchain
$WAVES Waves
$WAXP WAX
$WICC WaykiChain
$WIN WINk
$WTC Waltonchain
$WXT Wirex Token
$XEM NEM
$XET ETERNAL TOKEN
$XIN Mixin
$XLM Stellar
$XMR Monero
$XMX XMax
$XRP XRP
$XTP Tap
$XTZ Tezos
$XVG Verge
$XZC Zcoin
$YAP Yap Stone
$YOU YOU COIN
$ZB ZB Token
$ZEC Zcash
$ZEN Horizen
$ZIL Zilliqa
$ZRX 0x
Binance
Bittrex
HitBTC
Huobi
Kraken
Kucoin
✗ Close categories
✗ Close categories

-
Microsoft (MSFT) Stock Forecast & Predictions for 2024, 2025–2026 and Beyond
via litefinance.org Microsoft Corporation, a cornerstone in the tech industry, has consistently demonstrated resilience and innovation, making its stock (MSFT) a key player in many investors' portfolios. However, like other IT giants, Microsoft encounters occasional difficulties. One such massive and unprecedented outage occurred on July 19, 2024, when 8.5 million Windows computers worldwide stopped working. The problem was not Microsoft's operating system but an automatic update to an antivirus program from C


-
XAUUSD: Elliott wave analysis and forecast for 26.07.24 – 02.08.24
via litefinance.org Highlights and key points Main scenario: consider long positions above the level of 2291.67 with a target of 2560.00 – 2650.00 once a correction is over. A buy signal: after the level of 2291.67 is broken. Stop Loss: 2250.00; Take Profit: 2650.00. Alternative scenario: breakout and consolidation below the level of 2291.67 will allow the pair to continue declining to the levels of 2161.56 – 1988.70. A sell signal: after the level of 2291.67 is broken. Stop Loss: 2330.00; Take Profit:
-
WTI Crude Oil: Elliott wave analysis and forecast for 26.07.24 – 02.08.24
via litefinance.org Highlights and key points Main scenario: consider short positions from corrections below the level of 83.33 with a target of 72.30 – 67.60. A sell signal: after the level of 83.33 is broken. Stop Loss: 85.00; Take Profit: 67.60. Alternative scenario: breakout and consolidation above the level of 83.33 will allow the asset to continue rising to the levels of 90.95 – 95.25. A buy signal: after the level of 83.33 is broken. Stop Loss: 82.00; Take Profit: 95.25.Main scenarioConsider shor
-
USDJPY: Elliott wave analysis and forecast for 26.07.24 – 02.08.24
via litefinance.org Highlights and key points Main scenario: consider long positions from corrections above the level of 151.85 with a target of 165.00 – 170.00. A buy signal: after the level of 151.85 is broken. Stop Loss: 150.50; Take Profit: 170.00. Alternative scenario: breakout and consolidation below the level of 151.85 will allow the pair to continue declining to the levels of 146.44 – 140.75. A sell signal: after the level of 151.85 is broken. Stop Loss: 153.00; Take Profit: 140.75.Main scenario
-
GBPUSD: Elliott wave analysis and forecast for 26.07.24 – 02.08.24
via litefinance.org Highlights and key points Main scenario: consider long positions from corrections above the level of 1.2770 with a target of 1.3250 – 1.3740. A buy signal: after the level of 1.2770 is broken. Stop Loss: 1.2700; Take Profit: 1.3740. Alternative scenario: breakout and consolidation below the level of 1.2770 will allow the pair to continue declining to the levels of 1.2594 – 1.2300. A sell signal: after the level of 1.2770 is broken. Stop Loss: 1.2850; Take Profit: 1.2300.Main scenario
-
EURUSD: Elliott wave analysis and forecast for 26.07.24 – 02.08.24
via litefinance.org Highlights and key points Main scenario: consider long positions from corrections above the level of 1.0772 with a target of 1.1141 – 1.1273. A buy signal: after the level of 1.0772 is broken. Stop Loss: 1.0700; Take Profit: 1.1273. Alternative scenario: breakout and consolidation below the level of 1.0772 will allow the pair to continue declining to the levels of 1.0663 – 1.0500. A sell signal: after the level of 1.0772 is broken. Stop Loss: 1.0850; Take Profit: 1.0500.Main scenario
-
Gold Drops Ballast. Forecast as of 26.07.2024
via litefinance.org The yellow metal's pullback looks strange amid the market's confidence about the Fed's upcoming rate cuts. Could gold just be dropping insecure buyers? Let’s discuss it and make a trading plan for XAUUSD.Highlights and key points Strong US GDP data accelerated the precious metal's pullback. A decrease in Chinese demand drives the downward trend in the XAUUSD. Regardless of who becomes the American president, gold will win. A return above $2,410 per ounce will not be the only reason for buy
-
World stock market holidays: August 2024
via litefinance.org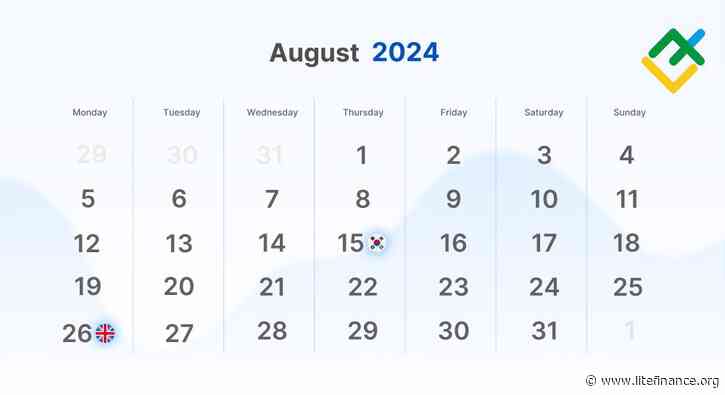 Dear clients,Please get acquainted with upcoming changes in LiteFinance’s trading schedule this month.Liberation Day, South Korea, 15.08.2024Trading instrument Closure Resumption USDKRW 22:59 14/08/2024 03:00 16/08/2024
Summer Bank Holiday, UK, 26.08.2024Trading instrument Closure Resumption FTSE 23:00 23/08/2024 03:00 27/08/2024 #AHT 18:30 23/08/2024 10:00 27/08/2024 #BAES 18:30 23/08/2024 10:00 27/08/2024 #BARC 18:30 23/08/2024 10:00 27/08/2024 #BATS 18:30 23/08/2024 10:00 27/08/2024 #BL
-
USDCHF: Elliott wave analysis and forecast for 26.07.24 – 02.08.24
via litefinance.org Highlights and key points Main scenario: consider short positions from corrections below the level of 0.9050 with a target of 0.8546 – 0.8325. A sell signal: after the level of 0.9050 is broken. Stop Loss: 0.9150; Take Profit: 0.8325. Alternative scenario: breakout and consolidation above the level of 0.9050 will allow the pair to continue rising to the levels of 0.9226 – 0.9451. A buy signal: after the level of 0.9050 is broken. Stop Loss: 0.8950, Take Profit: 0.9451.Main scenario&n
-
USDСAD: Elliott wave analysis and forecast for 26.07.24 – 02.08.24
via litefinance.org Highlights and key points Main scenario: consider long positions from corrections above the level of 1.3583 with a target of 1.4000 – 1.4200. A buy signal: after the level of 1.3583 is broken. Stop Loss: 1.3500; Take Profit: 1.4200. Alternative scenario: breakout and consolidation below the level of 1.3583 will allow the pair to continue declining to the levels of 1.3352 – 1.3166. A sell signal: after the level of 1.3583 is broken. Stop Loss: 1.3650; Take Profit: 1.3166.Main scenario
-
Short-term analysis for BTCUSD, XRPUSD, and ETHUSD for 26.07.2024
via litefinance.org Dear readers,I've prepared a short-term forecast for Bitcoin, Ripple, and Ethereum based on the Elliott wave analysis.Highlights and key points BTCUSD: an ascending wave 5 has started unfolding. Consider long positions from the current level with Take Profit at 69424.27. XRPUSD: the price is expected to rise in subwave 3. Consider buying from the current level with Take Profit at 0.703. ETHUSD: an ascending wave 3 has started forming. Consider long positions with Take Profit at 39
-
Trump Wants Weak US Dollar. Forecast as of 26.07.2024
via litefinance.org The robust US economy and elevated interest rates have prompted a surge in capital inflows, exerting downward pressure on the EURUSD exchange rate. Import tariffs and fiscal stimulus measures are poised to accelerate this trend. In this context, should the weak US dollar remain only on paper? Let's discuss this topic and make a trading plan.Highlights and key points The weak-dollar policy is Donald Trump's populism. The US economy is still strong. Trade wars will weaken US competitors. The 1.083
02 Aug 202401 Aug 202431 Jul 202430 Jul 202429 Jul 202425 Jul 202424 Jul 202423 Jul 202422 Jul 202421 Jul 2024
Follow @news_analyst on Twitter!